
There are a number of engagement tools that publishers can leverage to build digital communities. Before you commit to any community engagement solution, we want to make sure you’re fully benefiting from the tools you choose to invest in.
After all, it’s important to monitor a number of key metrics that measure the health and growth of your digital community. As you gather information on how your users are interacting with one another around your content, you can fine-tune your editorial and subscription strategies around audience behavior. Keep in mind that third-party cookies are no longer an effective way to capture your community’s information, meaning you now have to turn to the rich data from your own platform to collect it.
Set your business up for success by ensuring your engagement tools are giving you the following metrics:
Daily, weekly and monthly active users
While the number of new users is important to keep track of and could represent the success of your user acquisition strategies, it fails to take into account churn and loyalty. A growing, active user base, on the other hand, highlights the fact that you’re providing value to your community.
The definition of an active user depends on your individual objectives and product offering. For us, the number of active users includes active commenters, users who authenticate and users who spend more than five seconds reading comments.
A good rule of thumb is to aim for 20-40% of your monthly unique visitors to be in the active user category.
Engagement Velocity
The engagement velocity is essentially the number of aggregate engagement actions per minute. This is another helpful metric to keep track of that can help predict how popular your content will become based on the speed of user engagement with your front-facing tools.


Use this metric to find out how well your content is resonating with users.
Daily, weekly and monthly active engagement
“Many publishers are focused on fostering deeper engagement with loyal users, who exhibit a higher propensity to return, and ultimately to subscribe,” reads a new report by the Local Media Association.
Be sure to monitor the number of daily, weekly and monthly active engagement on your platform over time and across pages. Over time, it helps you measure the impact of strategic decisions, and across pages, it helps you identify highly engaging pages early on and improve their visibility to maximize conversions.
On average, we see an annual increase of 20% in active engagement across our clients.
Percent of user attention time in comment sections
Time spent on-page is a common metric that publishers keep a close eye on. But to get a thorough understanding of your audience’s engagement level, you need to dig a little bit deeper.
Most users are passive consumers of content — that means they are more likely to read than contribute to a conversation. For this reason, the percent of time users spend reading comments can be a good indicator of community engagement. While engagement will vary depending on article type, our clients see a monthly average of 9.46% to 26.53% of user attention time in commenting sections across their platforms (with some as high as 43%).
Looking to boost this number for your platform?
Last year, Microsoft conducted a study, which concluded that good content is the key to getting users to spend more time engaging with your content. This is especially important as the study found that the human attention span has been reduced from an average of 12 seconds to eight.
Moderated conversations can also be an asset in capturing user attention by helping users feel protected enough to participate in discussions.
Civility Trends
Your audience’s online engagement is in fact dependent on civility — toxicity has a negative impact on engagement, ad revenue and brand image.
To keep track of your community’s online health, monitor civility trends across your platform. This can be as simple as watching the rate of disabled posts (disabled posts / all posts), which allows you to assess at a high level if users, in general, are complying with your community guidelines.
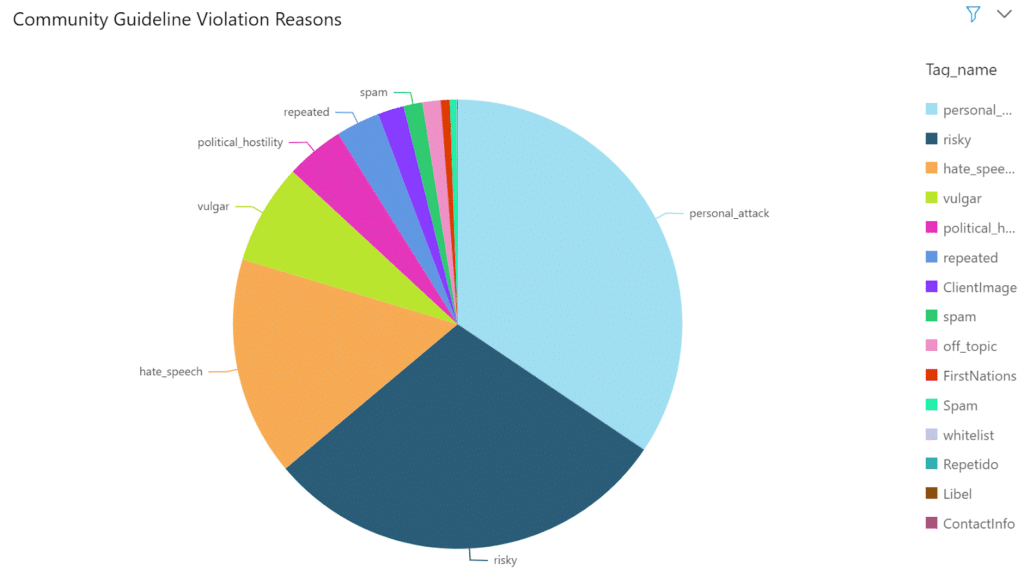
Dive a bit deeper into your engagement tools’ civility trends by monitoring the disabled posts even more closely. If you’re able to classify the reason behind disabling posts, you can monitor the violation trends and create strategies to resolve specific violation types. For example, if you’re seeing a lot of political hostility around an election, you may choose to keep a close eye on related articles in the politics section of your platform.
Here’s an example of one of our moderation dashboards:
Make the most of your engagement solutions by monitoring these metrics on a regular basis, and identify related strengths and weaknesses on your platform. Only then can you adjust your business’ strategies to build a loyal community.
If you’re unsure of where your numbers stand in the media industry, you can use the Google News Initiative tool to see where your data stands and set benchmarks to help your organization grow.
